
Application observability
Kanshi accepts standard OTLP traces and logs on Core’s authenticated gRPC port. Applications include an official OpenTelemetry SDK dependency and send telemetry to an OpenTelemetry Collector. The Collector batches requests, adds the Kanshi ingest key, and forwards them to Core.
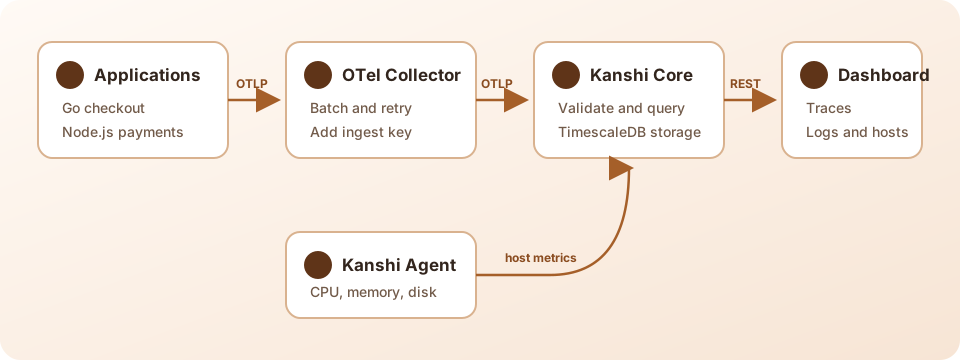
The Agent remains separate. It reports CPU, memory, and disk metrics for the host while application SDKs report traces and logs.
Try the complete workflow
Section titled “Try the complete workflow”The disposable demo includes the Collector, Agent, and instrumented Go and Node.js services:
git clone https://github.com/kanshi-dev/demo.gitcd demomake upmake verifyNo separate OpenTelemetry installation is required. Docker pulls the prebuilt checkout, payments, and Demo Driver images and runs the Collector as a container.
Open http://localhost:3000, enter the dashboard key printed by make up, and select Services. The verification request creates an error trace across the checkout and payments services with logs linked to both spans.
Configure the Collector
Section titled “Configure the Collector”The minimum Collector pipeline receives OTLP over gRPC, batches it, and authenticates to Core:
receivers:  otlp:    protocols:      grpc:
processors:  batch:
exporters:  otlp/kanshi:    endpoint: core.example.com:50051    headers:      x-api-key: ${env:KANSHI_API_KEY}
service:  pipelines:    traces:      receivers: [otlp]      processors: [batch]      exporters: [otlp/kanshi]    logs:      receivers: [otlp]      processors: [batch]      exporters: [otlp/kanshi]
Set KANSHI_API_KEY on the Collector to the same ingest key configured on Core. Keep the Collector endpoint private so applications do not need the Kanshi key.
For local plaintext Core, add this under otlp/kanshi:
tls: insecure: trueThe demo Collector configuration adds a memory limiter, bounded sending queue, and retry policy suitable for a local proof.
Instrument Go
Section titled “Instrument Go”Add the official OpenTelemetry Go trace and log SDKs plus the OTLP gRPC exporters:
go get go.opentelemetry.io/otel \ go.opentelemetry.io/otel/sdk \ go.opentelemetry.io/otel/sdk/log \ go.opentelemetry.io/otel/exporters/otlp/otlptrace/otlptracegrpc \ go.opentelemetry.io/otel/exporters/otlp/otlplog/otlploggrpcCreate one tracer provider and one logger provider at process startup, set service.name, and shut both providers down when the process receives SIGTERM. Pass the active request context to log emission so the SDK records the trace and span IDs.
The complete minimal implementation is the demo’s Go checkout service. Point it at the Collector:
OTEL_EXPORTER_OTLP_ENDPOINT=collector:4317 ./checkoutInstrument Node.js
Section titled “Instrument Node.js”Add the official Node.js API, SDK, and OTLP gRPC exporters:
npm install @opentelemetry/api @opentelemetry/api-logs \ @opentelemetry/sdk-trace-node @opentelemetry/sdk-logs \ @opentelemetry/exporter-trace-otlp-grpc \ @opentelemetry/exporter-logs-otlp-grpcRegister the trace provider before handling requests, set service.name, and emit logs while the request span is active. Shut down both providers on SIGINT and SIGTERM.
The complete minimal implementation is the demo’s Node.js payment service. Point it at the Collector:
OTEL_EXPORTER_OTLP_ENDPOINT=http://collector:4317 node app.mjsOnce a request reaches both services, search Services by service name or trace ID. Select the trace to inspect its parent-child span waterfall and correlated logs.
Production safety
Section titled “Production safety”Authentication and TLS
Section titled “Authentication and TLS”Core requires x-api-key for both OTLP and Agent ingestion. Put the key on the Collector, not in each application, and keep Collector receivers private.
Use TLS between the Collector and Core on untrusted networks. Remove tls.insecure, trust the CA that issued Core’s certificate, and set tls.server_name when its certificate name differs from the endpoint. Kanshi does not terminate TLS itself, so place Core behind a TLS proxy or private load balancer.
Use a different dashboard bearer key for REST access. Rotate the ingest key if it is exposed.
Sampling
Section titled “Sampling”Kanshi stores the telemetry it receives. Configure sampling in the SDK or Collector before export. Parent-based trace ID ratio sampling at 0.1 is a reasonable starting point, then adjust it from measured volume. Keep error traces when possible and preserve the parent sampling decision across service boundaries.
Limits and retention
Section titled “Limits and retention”Core rejects telemetry outside these trust-boundary limits:
| Limit | Value |
|---|---|
| gRPC message | 4 MiB |
| Spans or log records per request | 1,000 |
| Attributes per resource or record | 64 |
| Encoded attributes | 32 KiB |
| Log body | 16 KiB |
REST searches default to the latest hour, allow at most 24 hours, and cap limit at 500. Trace retention defaults to 7 days and correlated log retention to 3 days:
KANSHI_TRACE_RETENTION=168hKANSHI_LOG_RETENTION=72hBoth values accept Go duration syntax and have a minimum of one hour.
Redaction
Section titled “Redaction”Telemetry is application data. Remove credentials, authorization headers, session tokens, payment details, and unnecessary request bodies before they reach the Collector. Prefer stable identifiers over personal data in span and log attributes. Collector processors can delete or transform sensitive fields centrally, but the safest value is one the application never records.
Troubleshooting
Section titled “Troubleshooting”No service or trace appears
Section titled “No service or trace appears”- Confirm the application uses a non-empty
service.name. - Check that its OTLP endpoint reaches the Collector gRPC receiver.
- Check Collector logs for
Unauthenticated,InvalidArgument, or connection errors. - Confirm the Collector sends
x-api-keyand that it matches Core’sKANSHI_API_KEY. - Search a time range that includes the request and check whether sampling dropped it.
Core rejects malformed IDs, missing service names, timestamps over five minutes in the future, and timestamps older than configured retention.
The trace appears without logs
Section titled “The trace appears without logs”Confirm the application created a log SDK provider and a log OTLP exporter. Console logging alone does not export OTLP logs. Flush or shut down the provider during graceful process termination so buffered records are sent.
Logs are not correlated
Section titled “Logs are not correlated”Emit the log while the request span context is active. For asynchronous work, propagate the active context into the callback or task. The exported log must contain the same trace ID and span ID as the target span.
Spans are not parented across services
Section titled “Spans are not parented across services”Instrument outgoing and incoming requests or inject and extract W3C Trace Context manually. Confirm proxies preserve the traceparent header. A valid distributed trace uses one trace ID with a different span ID for each operation.
Collector exports fail
Section titled “Collector exports fail”Unauthenticated: fix thex-api-keyheader.ResourceExhausted: reduce batch size below the 4 MiB gRPC limit.InvalidArgument: inspect Core logs for the rejected field or limit.- TLS handshake failure: verify the trusted CA, endpoint name, and
tls.server_name.
Start with the demo configuration and run make verify before adapting the topology.